This tutorial will walk you through the filters specific to Equity ETFs you can choose from when screening for Equity ETFs. AlphaBeta ETF identifies three key filters, namely Market Cap, Sector, and Factor, as the foundation to look for the right Equity ETF for you.
What are the Equity-specific filters I can use?
Market Cap: The total dollar value of a company’s outstanding shares, calculated by multiplying the current share price by the total number of shares held by stockholders. Different index providers have different thresholds for Large, Mid and Small Cap stocks. They usually define market cap categories as a certain number or percentage of the top / middle / bottom stocks of all the listed companies by market cap within a universe.
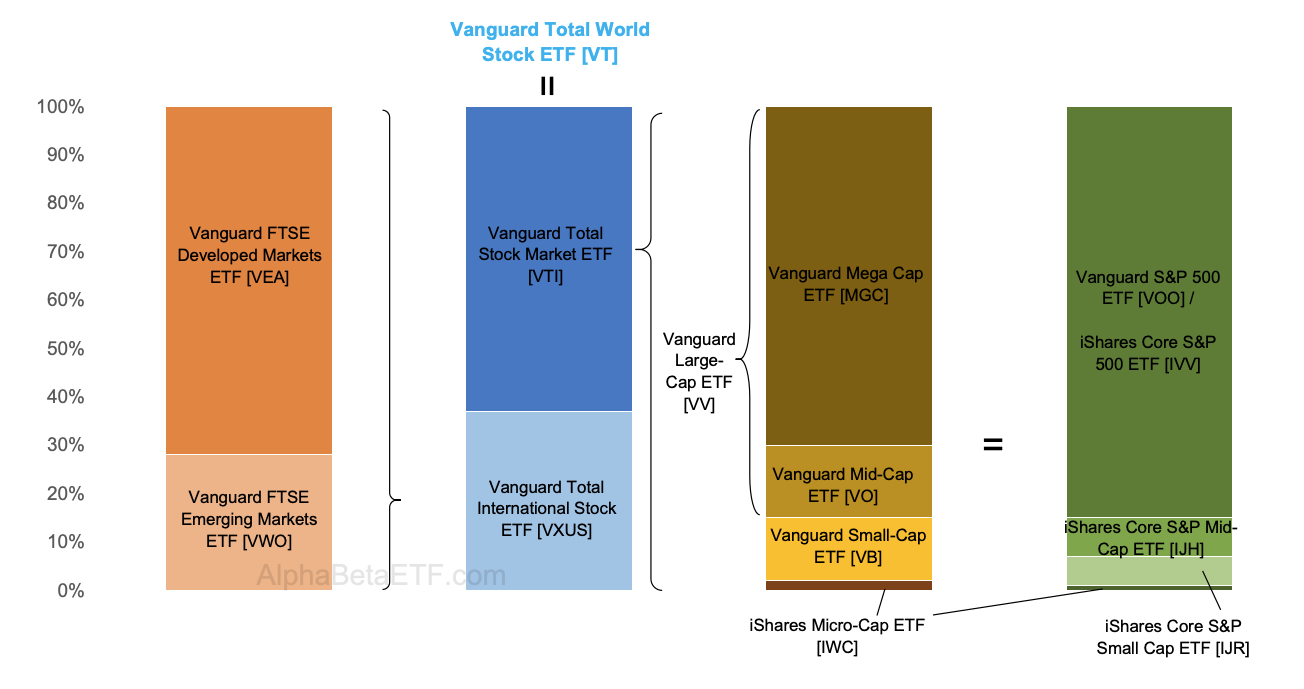
As an overview, Vanguard Total World Stock ETF [VT] , which provides coverage of Global Blend Cap stocks, can be decomposed into other ETFs by market cap, regions and markets as below:
Comparisons of commonly used equity indices, including CRSP, S&P and Russell, are listed below:
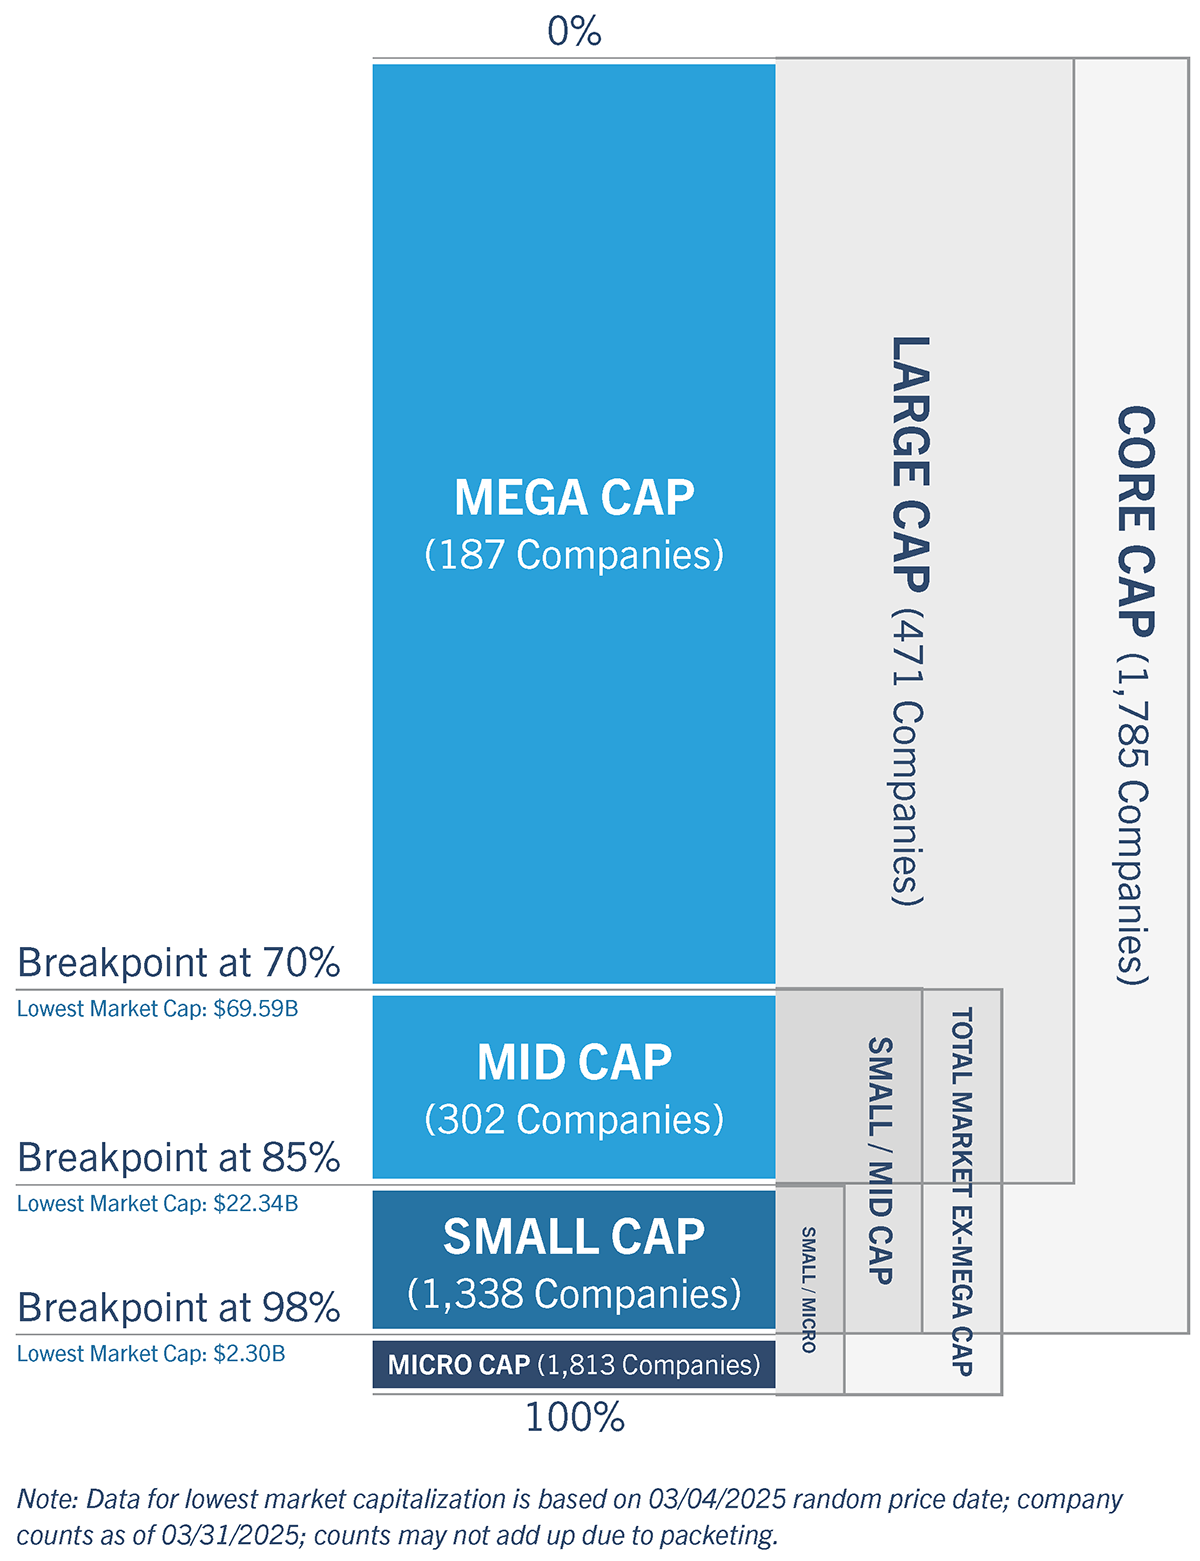
CRSP (Center for Research in Security Prices)
The CRSP US Index family, managed by the Center for Research in Security Prices at the University of Chicago, is most notably recognized for its partnership with Vanguard, which uses these benchmarks for many of its largest passive funds. Unlike traditional benchmarks that use a static number of companies, CRSP membership is determined by a percentage-weight of the total investable market capitalization. Unlike S&P 500, the large cap US index by S&P (see below), roughly 300 stocks of the CRSP US Large Cap Index are actually classified as mid caps by CRSP.
S&P (Standard and Poor's)
As of Dec 2025, the market capitalization thresholds for the S&P indices are as follows:
- S&P 500: At least US$ 22.7 billion
- S&P MidCap 400: US$ 8.0 billion to US$ 22.7 billion
- S&P SmallCap 600: US$ 1.2 billion to US$ 8.0 billion
- S&P Composite 1500: Combination of the above indices
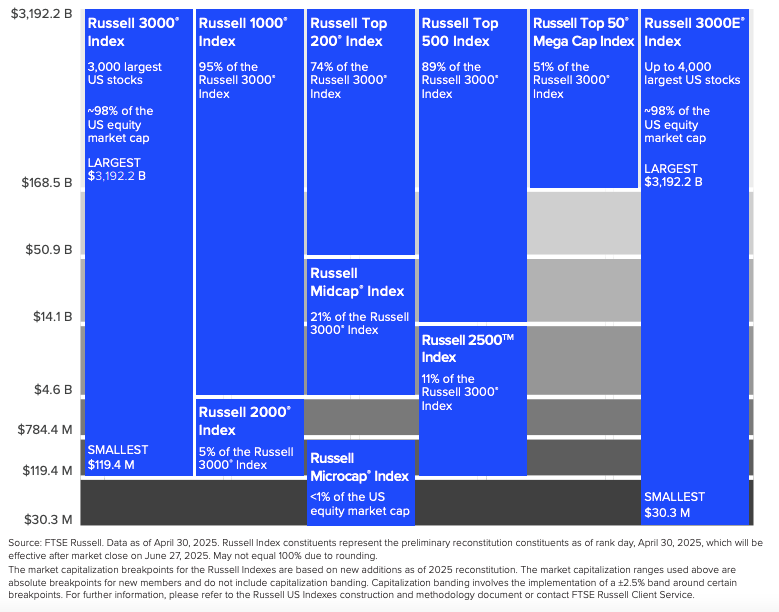
Russell
The categorization of Russell indices by market cap are as below:
- Russell 1000 Index: The largest 1,000 stocks by market cap, the index comprehensively covers the large and mid cap opportunity set.
- Russell 2000 Index: The next 2,000 largest stocks by market cap, the index comprehensively covers the small cap opportunity set.
- Russell 3000 Index: This broad cap index of the top 3,000 US stocks by market cap was designed to cover approximately 98% of the US equity investable universe.
Market Cap-weighted vs Equal-weighted indices
The fundamental trade-off centers on diversification versus concentration risk and volatility. Equal-weight indices provide greater exposure to stocks with smaller mkt cap but with higher volatility. Equal weighting is said to be value-driven, mechanically buying depressed stocks and selling appreciated ones, whereas market cap-weighting follows momentum, concentrating in companies that have already appreciated.
Sector: The industry or type of business that the company participates in. A widely adopted standard is Global Industry Classification Standard (GICS).
Description: The 11 sectors (Communication Services, Consumer Discretionary, Consumer Staples, Energy, Financials, Health Care, Industrials, Information Technology, Materials, Real Estate, and Utilities) provide market-oriented segmentation by grouping companies with similar economic sensitivity and consumer demand characteristics into the same sector.
Example: Information Technology – Vanguard Information Technology ETF [VGT]; Financial – Financial Select Sector SPDR Fund [XLF]
Factor: A factor in equity investment is a broad, persistent driver or characteristic of a stock that explains differences in risk and return among various stocks. Factor investing involves systematically targeting securities that exhibit these specific, quantifiable traits. You can use factors to build diversified portfolios, manage risk, or seek enhanced returns.
Core
Description: Typically denotes the broadest, most liquid segment of equities as the foundational universe for portfolio construction, and does not tilt towards one or more specific factors listed below.
Value
Description: Identifies stocks trading at discounts to intrinsic value. Common considerations include Price-to-Book ratio and Price-to-Earnings ratio. Value stocks are typically mature, established companies with lower price-to-earnings and price-to-book ratios, and are usually categorized as pro-cyclical, which tend to outperform during economic recoveries and periods of higher inflation.
Example: Vanguard Value ETF [VTV]
Growth
Description: Captures companies expected to expand earnings and sales at above-average rates relative to peers or the broader market. Growth companies typically reinvest earnings rather than pay dividends, are concentrated in innovation-driven sectors (such as Technology), and command higher valuations with greater volatility exposure.
Example: Vanguard Growth ETF [VUG]
Quality
Description: Represents companies with durable competitive advantages, sustainable earnings, and robust financial health, measured by Return on Equity (ROE), Debt-to-Equity ratios, etc. Quality stocks demonstrate defensive characteristics during market stress as investors seek flight to quality.
Example: Invesco S&P 500 Quality ETF [SPHQ]
Dividend
Description: Isolates companies with historically stable and increasing dividend payouts while filtering for sustainability, measured by metrics such as dividend yield, dividend payout ratios, and dividends-per-share growth. Categorized as defensive, Dividend ETFs have historically provided regular income alongside equity participation.
Example: Dividend Yield – Vanguard High Dividend Yield Index ETF [VYM]; Dividend Growth – iShares Core Dividend Growth ETF [DGRO]
Volatility
Description: Targets stocks with lower price fluctuations and reduced downside risk through optimization-based construction that accounts for both individual stock volatility and correlation effects between securities. Minimum volatility strategy is a defensive factor that peaks during economic contractions and bear markets, but underperforms the broad market during a strong upcycle.
Momentum
Description: Captures the tendency of winning stocks to continue outperforming over a certain recent period (e.g. 6 to 12 months), but often excluding the most recent month to account for short-term reversal effects. Momentum is categorized as a persistence factor that benefits during long, stable market trends. Nevertheless, it could experience occasional underperformance when market trends reversed.
Example: Invesco S&P 500 Momentum ETF [SPMO]
Multi-Factor
Description: Includes more than one non-Core factor listed above as consideration in portfolio construction. Note that Multi-Factor ETFs still have factor tilt towards more than one non-Core factor, while Core ETFs do not tilt towards one or more specific factors.
Thematic
Description: Provide targeted exposure to long-term megatrends and transformational economic themes rather than traditional sector classifications. Thematic ETFs span multiple sectors unified by a common investment theme, such as artificial intelligence, clean energy, cybersecurity, electric vehicles, etc.
Sector
Description: The ETF focuses on companies within a particular industry or type of business (see above description on Sector filter).
Example: Information Technology – Vanguard Information Technology ETF [VGT]; Financial – Financial Select Sector SPDR Fund [XLF]
Single Stock
Description: The underlying asset of the ETF is a specific stock. Single stock ETFs usually offer inverse or/and leveraged exposure to the performance of the underlying stock.
How to pick the right combination of the above Equity-specific considerations?
Understanding your exposures
Relationship among Market Cap, Sector and Factor: These three key considerations in picking Equity ETFs are deeply interconnected. Having biased exposure in one of these considerations inherently dictates its underlying fundamental characteristics of other considerations.
- For instance, US Large Cap and US Growth ETFs currently exhibit a heavy tilt toward the Information Technology sector, which as of 2026 continues to drive the momentum factor but also increases concentration risk.
- Conversely, Small Cap ETFs naturally gravitate toward a Value tilt with a cyclical sector focus on Consumer Discretionary, Real Estate, and Industrials, offering more direct exposure to the domestic economy. However, this smaller capitalization profile also introduces higher volatility and sensitivity to interest rate fluctuations.
- Ultimately, an investor’s choice in any of Market Cap, Sector or Factor may imply a specific set of characteristics of the other two that define the ETF’s performance profile.
Region and Country Allocation: When selecting between equity regions like the US, Europe, and Asia, you can also evaluate how regional economic drivers and market structures align with their portfolio goals. Common considerations include economic drivers of various regions, sector allocation of equity indices, and currencies.
Economic Drivers
Consider whether you are seeking the stability of mature, developed economies or the higher growth potential of emerging markets. Regions like the US often offer resilient, moderate growth driven by consumer spending and innovation, while parts of Asia typically provide much faster expansion powered by industrialization and a rising middle class. Europe often sits in the middle, influenced heavily by global trade and fiscal integration.
Sector Allocation
Each region has a unique set of characteristics based on its dominant industries. The US market is heavily weighted toward high-growth technology and software, making it ideal for aggressive capital appreciation. Europe is traditionally more cyclical, with significant exposure to financials, healthcare, and industrials, which may offer better value and dividends. Asia provides a balance, offering heavy weights in the global hardware supply chain and manufacturing sectors.
Currency Impacts
Investing internationally introduces currency risk. A stronger local currency can boost your returns when profits are converted back to your home currency, while a weaker currency can make that region’s exports more competitive globally. Monitor how central bank interest rate differentials might cause currencies like the Euro, Yen, or Dollar to fluctuate, as these movements can sometimes outweigh the actual performance of the underlying stocks.
Risk appetite and Macroeconomic conditions
⬤
Risk Appetite: Investors with lower risk tolerance levels should look for Equity ETFs with lower volatility or maximum drawdown, such as Dividend factor ETFs or Low Volatility factor ETFs. For those that are willing to accept a higher risk in order to enjoy a higher potential return, Growth ETFs or Sector / Thematic ETFs that provide exposure to high-growth sectors and companies are potential candidates to be added to their portfolios.
Macroeconomy and market conditions: Common considerations and comparisons include Cyclical vs Defensive, and U.S. vs Ex-U.S. / DM vs EM.
Cyclical vs Defensive
- Cyclical stocks, typically in Industrials, Consumer Discretionary, Energy, and Materials sectors, exhibit earnings and valuations highly sensitive to GDP growth, employment trends, and consumer spending patterns. They significantly outperform during economic expansion phases when confidence is rising and leverage is accessible, but experience sharp drawdowns during recessions when demand collapses and financing conditions tighten.
- Conversely, defensive stocks in Consumer Staples, Utilities and Health Care provide essential goods and services insensitive to economic cycles, delivering stable dividends and lower volatility during contraction periods but lagging during strong expansions when investors rotate toward higher-return cyclical exposures.
- Investors with lower tolerance for macroeconomic uncertainty and expectations of slower growth should allocate toward defensive equity indices, while those expecting robust growth acceleration should favor cyclically-leveraged indices.
US vs Ex-U.S. / DM vs EM
- The U.S. market has been driven by tech and artificial intelligence over the past few years as of end-2025, with earnings and share price growth dominated by the Magnificent 7 (Apple, Microsoft, Amazon, Alphabet, Meta Platforms, Nvidia, and Tesla) alongside other tech stocks. Developed Ex-U.S. markets (Europe, Japan, Canada) usually benefit from monetary easing creating earnings leverage in cyclical sectors, while Emerging markets are driven by demographic and competitive advantage in manufacturing industries. Picking the right regional allocation requires the analysis of the earnings growth and valuation drivers of different markets.
- Valuation disparities between US and international equities have widened considerably as of end-2025, with S&P 500 trading at a higher P/E ratio above ex-U.S. markets. The elevated U.S. multiple is justified by superior earnings growth, though any deceleration from tariff impacts, fiscal tightening, or slowing productivity gains would subject U.S. equities to multiple compression risk.
- Currency dynamics also significantly influence international equity returns, particularly given U.S. fiscal and monetary policy uncertainties. A sustained weaker U.S. dollar provides tailwind returns for Ex-U.S. and Emerging markets investors. However, geopolitical issues such as tariff policy introduces dual-edged risk. Trade-sensitive international and emerging markets are exposed to slower global growth and currency volatility from capital flow reversals.