
Many investors of High Dividend ETFs focus on the dividend yield of such ETFs. In reality, how important is dividend yield in contributing to total return of the ETFs? Are there other factors that are more important in evaluating the performance of Dividend ETFs?
Unlike many existing analyses which focus on absolute returns, we analyzed the EXCESS RETURN (also known as Alpha) over the past 15 years of the whole High Dividend ETF universe, across 40 funds versus various market indices, and will walk you through our findings in this article.
To begin with, let’s look at the breakdown of total return (dividends reinvested) by calendar year for Schwab US Dividend Equity ETF (SCHD), one of the most popular Dividend ETFs that offer attractive yield at 3-4% historically:
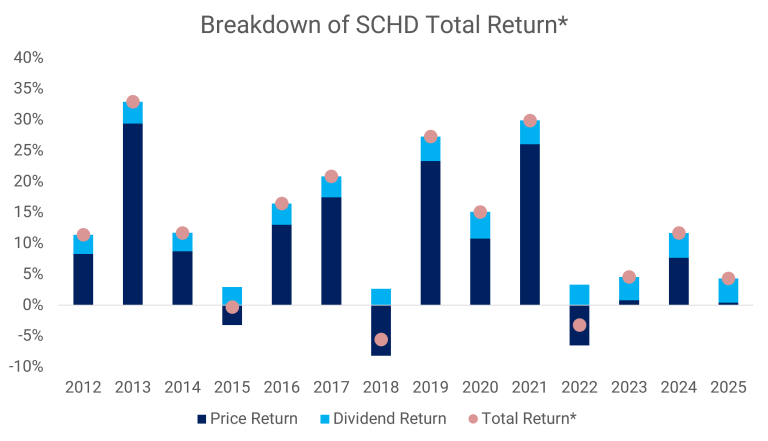
*Total return with dividends reinvested
SCHD delivered ~12% return per year throughout the period, thus ~70% of return was from price appreciation and ~30% from dividends. The picture is similar for other High Dividend ETFs offering good yields, such as iShares Select Dividend ETF (DVY). Thus, if you have multiple High Dividend ETFs under your portfolio or watchlist, understanding the drivers of their performance apart from dividend yield is essential in your selection of ETFs. Even if you want to implement a buy-and-hold strategy for your Dividend ETFs, it is still essential to know why they outperform or underperform and review regularly, as it still matters to your asset size and the absolute amount of dividends you receive.
First, let’s look at the excess return (alpha) of the median of High Dividend ETFs vs MSCI US Index, for each calendar year since 2012. For the universe of High Dividend ETFs used in the analysis, the below Custom Filters are used in our ETF Screener:
1. Key Filters:
- Asset Class: Equity
- Market Cap: Blend Cap, Large Cap
- Sector: Blend Sector
- Factor: Dividend
- Asset Class: Equity
2. Fund Characteristics:
- Exposure: Long
- Instrument: Vanilla
3. Geography:
- Country: U.S.
4. Basic Information:
- Yield (%): Minimum 2.5
This is the 1-year return and risk profile of the High Dividend ETFs filtered based on the above criteria, which you can find after applying the above filters to our ETF Screener, in the tab “Period%”, under the session “Performance Comparison” – tab “Scatter”.
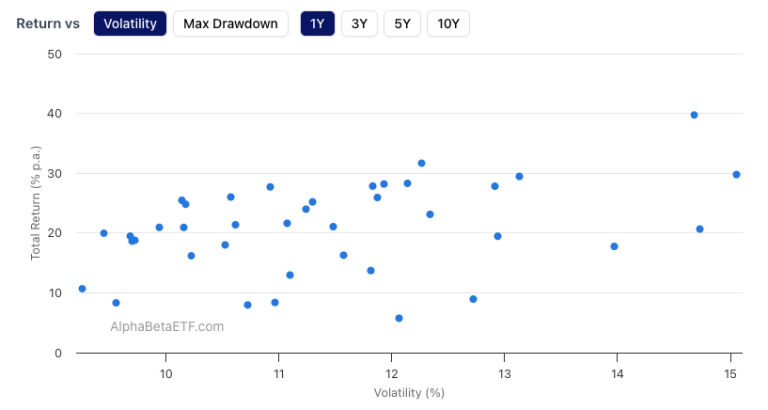
The median of the return of the High Dividend ETFs universe screened above is used to calculate the excess return vs MSCI US Index, which is part of the input in our analysis in next session:
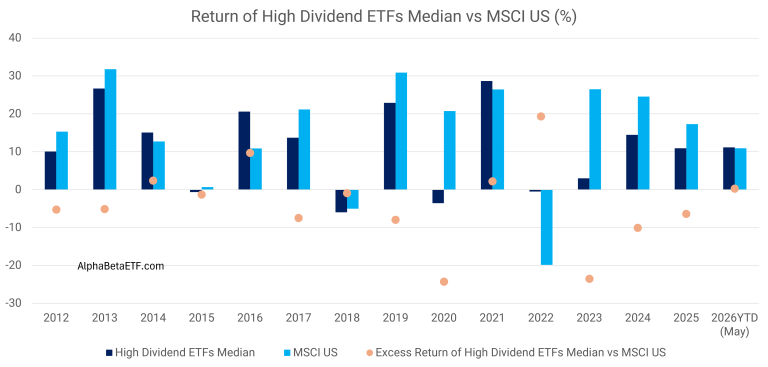
You can see the performance of High Dividend ETFs varied at different degrees versus the market at different times. Now we come to the question: What drives this variance?
What are Factors? How do they affect the performance of High Dividend ETFs?
A factor is a driver or characteristic of a stock that explains differences in risk and return among various stocks. Factor is one of the key equity specific filters used to screen for equity ETFs. Common Factors used in ETF classification and return analysis include Value, Quality, Growth, Low Volatility, Dividend, Momentum, etc. For the various Factor filters available in our ETF screener, you may visit How to find my suitable Equity ETF? and go to the “Factor” session to see what metrics and characteristics each Factor refers to.
Our focus in this article is High Dividend ETFs, and Value factor is found to have high correlation to the performance of High Dividend ETFs. Value stocks are typically mature, established companies with lower price-to-earnings and price-to-book ratios, and are usually categorized as pro-cyclical, which tend to outperform during periods of higher inflation.
To demonstrate the relationship between Value factor and High Dividend ETFs, first we have to compute two sets of excess return:
- The excess return (alpha) of MSCI US Value Index vs MSCI US Index
- The excess return (alpha) of the median of High Dividend ETFs vs MSCI US Index
Note: If you want to find the ETFs that track the MSCI indices, iShares MSCI USA Value Factor ETF (VLUE) tracks MSCI US Value Index, while Invesco MSCI USA ETF (PBUS) tracks MSCI US Index.
The below chart plots 1) the excess return of High Dividend ETFs vs the market, against 2) the excess return of Value Index vs the market. The higher the excess return of Value Index vs the market, the higher is the excess return of High Dividend ETFs median vs the market:
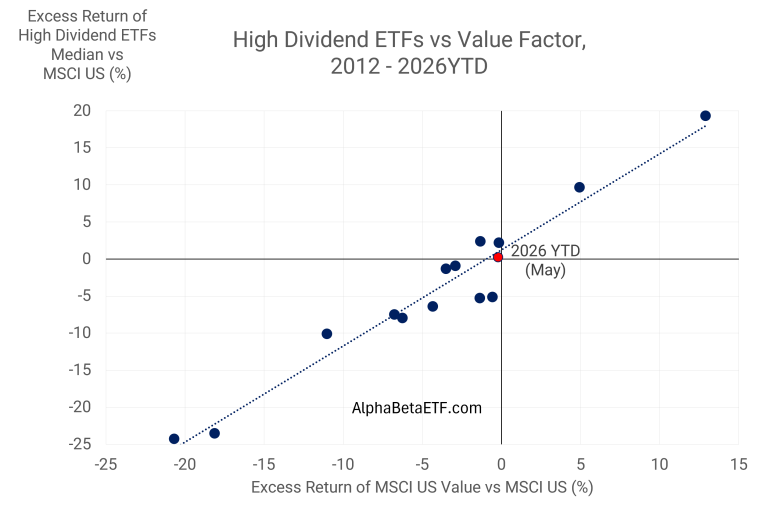
Because both High Dividend stocks and Value stocks share the same characteristics of more mature businesses that have lower valuation, steady cash flows and lower growth, when Value factor performs well, High Dividend ETFs also tend to perform well. They are usually categorized as pro-cyclical, which tend to outperform during periods of higher inflation. For instance, 2022 was the year where high inflation caused the equity market to correct significantly, with MSCI US down close to 20%. Yet, Value index was only down by ~7%, and the median return of High Dividend ETFs was only down 0.5%.
Is Value the only factor that affects the performance of High Dividend ETFs?
Most High Dividend ETFs pick constituents based mainly on dividend amount or dividend yield, but some of them have additional criteria in stock screening, and thus are affected by factors outside Value as well.
Take SCHD as an example. Eligible securities are ranked by each of four fundamentals-based characteristics:
- Free cash flow divided by total debt
- ROE (Return on Equity): A company’s trailing 12-month basic earnings per share excluding discontinued operations & extraordinary items, divided by the company’s latest quarter Book Value Per Share.
- Dividend yield (excluding special dividends)
- Five-year dividend growth rate
The first two fundamental metrics, i.e. Free cash flow divided by total debt and ROE, focus on the financial health and profitability of companies, which are also the characteristics that the Quality factor looks at. Quality factor represents companies with durable competitive advantages, sustainable earnings, and robust financial health, demonstrating defensive characteristics during market stress as investors seek flight to quality.
SCHD stands out among High Dividend ETFs as it has a Quality factor screening on high dividend stocks. If we plot the excess return of SCHD vs High Dividend ETFs, against excess return of Quality Index vs the market, we can see their positive correlation below:
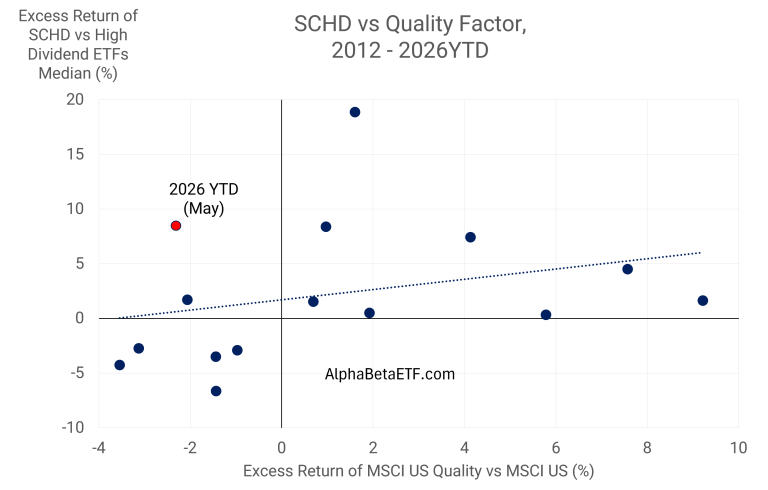
Note: High Dividend ETFs median return excludes SCHD in the above chart
Thanks to the Quality factor screening on stocks, SCHD has been able to outperform its High Dividend peers when Quality factor is doing well. However, if Quality factor underperforms the market, SCHD likely underperforms its High Dividend ETF peers.
Why sometimes SCHD’s excess returns deviated so much from the trendline above? Sector allocation and stock selection also matters.
Take 2026 year-to-date till May as an example, when the excess return of Quality vs the market was -2.3% but the excess return of SCHD vs its peers was way higher at +8.5%. This means there are other drivers outside factors (Value, Quality,etc) that drive the performance of ETFs vs the market. Sector exposure and stock selection can help explain the performance of ETFs on top of factors.
The excess return of ETFs versus the market can actually be broken down into two main drivers:
- Performance of factors relevant to that ETF, such as Value, Quality, etc (discussed in this article)
- Sector allocation and stock selection (will be discussed in an upcoming article)
Conclusion
This article provides the framework of how to evaluate the excess return of an ETF versus the market based on the first main driver: relevant factor exposures. In the case of High Dividend ETFs the relevant factor is Value. For some High Dividend ETFs with Quality factor screening like SCHD, Quality is the other relevant factor.
In an upcoming article, we will explore how the second driver, i.e. sector exposure and stock selection, drives the return of ETFs. Please stay tuned.